Spreadsheets as the Foundation of Modern Data Management in the Digital Era
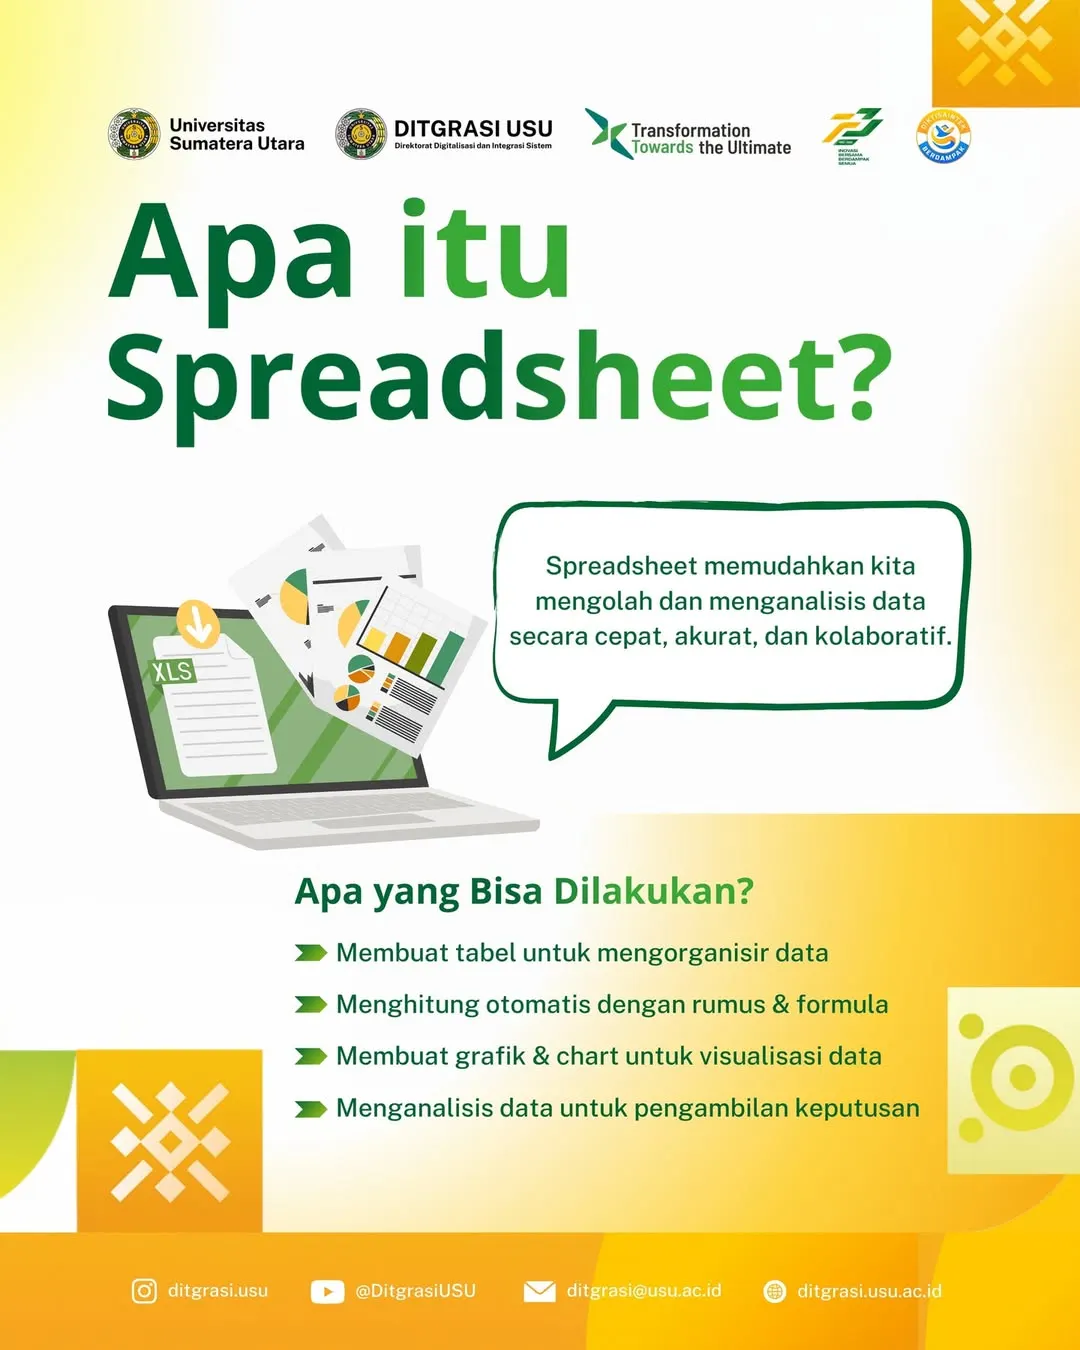
A spreadsheet is a table-based data processing application that allows users to work with numbers, text, formulas, and charts in a structured manner.
Article
Amidst the rapid development of information technology, the ability to manage data has become an increasingly important skill for students, education personnel, and professionals in various fields. One of the most widely used tools in data processing is the Spreadsheet, a tool designed to assist users in organizing, calculating, and analyzing data efficiently.
To improve the digital literacy of the academic community (sivitas akademika), the Directorate of Digitalization and System Integration (Ditgrasi USU) provides education regarding the important role of spreadsheets in both academic and administrative activities. Understanding spreadsheets not only improves work efficiency but also supports the accuracy and quality of data-driven decision-making.
A spreadsheet is a table-based data processing application that allows users to work with numbers, text, formulas, and charts in a structured manner. Through Spreadsheets, data can be processed quickly and accurately, and collaborated on by multiple users simultaneously.
The most familiar spreadsheet applications used in academic and professional environments include Microsoft Excel, Google Sheets, and LibreOffice Calc.
Spreadsheets have various functions that make them essential tools in data processing. Some of the main capabilities include:
1. Creating Tables to Organize Data Spreadsheets allow data to be arranged systematically in rows and columns, making it easier to read, monitor, and process. Users can store large amounts of data with a neat and standardized structure.
2. Calculating Automatically with Formulas One of the main strengths of a spreadsheet is its ability to perform automatic calculations. Mathematical formulas, statistics, and even logical functions can be implemented easily to support complex data analysis.
3. Creating Graphs and Charts for Data Visualization Spreadsheets also provide visualization features that allow users to display data in the form of bar charts, line graphs, pie charts, and various other visual types. These visualizations help simplify the understanding of data trends and patterns.
4. Analyzing Data to Support Decision Making Through a combination of processing and calculation features, spreadsheets are very effective for conducting comprehensive analysis. The analysis results can be used as a basis for decision-making processes in both academic and administrative environments.
For students, spreadsheets are highly beneficial tools for:
- Processing research data.
- Compiling academic reports.
- Calculating grades.
- Creating student organization budgets.
- Managing projects or activities.
With such extensive capabilities, spreadsheet proficiency is a basic skill that must be possessed by every individual wishing to compete in the digital era.
To support the creation of a technology-based academic ecosystem, Ditgrasi USU consistently conducts education, training, and publication related to digital literacy. Understanding spreadsheet usage is a key focus, given its crucial role in data transformation toward more effective and modern work processes.